1Institute of Electron Physics, National Academy of Sciences of Ukraine, Uzhhorod, Ukraine.
2State University “Uzhhorod National University”, Uzhhorod, Ukraine.
3Uzhhorod Scientific Lyceum of the Transcarpathian Regional Council, Uzhhorod, Ukraine.
Yu A Bandurin
Email: bandurin_unc@ukr.net
Received : Dec 20, 2024 Accepted : Jan 22, 2025 Published : Jan 29, 2025 Archived : www.meddiscoveries.org
The measurement technique and the results obtained by optical spectroscopy during excitation of bacterial biomass Staphylococcus aureus, Staphylococcus saprophyticus and Рseudomonas aerugenosa by photons described. The photoluminescence spectra of bacterial biomass studied in the wavelength range 440-740 nm during excitation by photons with 405 nm wavelength. Peculiarities were found in the luminescence spectra (radiation intensity, several maxima), indicating the excitation of the OH radicals and porphyrin by photon impact. After 5 days intensity of photoluminescence dramatically decreased, but still demonstrated differences between bacteria.
In the last decade, much attention of researchers from all over the world has been focused on the timely and rapid detection of pathogenic bacteria. In particular, it is important to identify staphylococci pathogenic for humans, infections of which are often found all over the world. They significantly affect the morbidity and mortality of people, and cause significant economic losses due to loss of working capacity. In the conditions of the war in Ukraine, the importance of identifying Pseudomonas aerugenosa bacteria, which, like staphylococci, often infects wounds, which can cause serious complications and amputations, is increasing. Developed portable fluorescent scanners [1,2] of infected wounds have not yet become widespread in Ukraine.
The situation is also difficult with pathogenic bacteria of food origin, which are often recorded all over the world and significantly affect even the socio-economic development of individual countries. Scientists are investigating the possibility of using the phenomenon of photoluminescence for fast and reliable detection of bacteria [3-11]. Both the study of this phenomenon for various bacteria [3,5,8-11], and the development of diagnostic methods [4,13,14,16-18] are taking place.
The situation with the infection of teenagers is also complicated due to constant contact with bacterial environments. Sowing made from a smear taken from the surface of an average school desk on special agar media with the help of an ordinary optical microscope made it possible to detect the presence of staphylococci - Staphylococcus aureus, Staphylococcus epidermidis, Staphylococcus saprophyticus and enterobacteria Escherichia coli and Enterobacter cloacae, as well as bacteria of the genus Pseudomonas.
When carrying out experiments on the study of photoluminescence of bacteria, it is very important to solve two problems. The first is to obtain information from the bacteria themselves, and not from their solutions, since very often solvent molecules significantly distort the luminescence spectra. The second is the determination of the necessary wavelength of the exciting photons and the search for the appropriate spectral range where the luminescence of a specific species of bacteria is manifested. We tried to solve these two problems.
Preparation of bacterial strains
Bacterial strains used in this study were:
Staphylococcus aureus ATCC 12600 (STA);
Staphylococcus saprophyticus ATCC 15305 (STS);
Pseudomonas aeruginosa ATCC 27853 (PDA).
All bacteria were cultured onto nutritive agar medium for 1 and 5 days. Full microbiological loop of the cell mass from the colonies taken without growing medium were applied as a film less than 1 mm thick onto the area of 1 cm2 of plastic slide, prepared from black floppy disc. The use of such pads is due to both their black color and matte surface. This prevents the reflection and scattering of light from the irradiating photons. In addition, this material is inert to the bacterial environment. Before measuring the photoluminescence of bacteria, we conducted a study of the radiation spectrum of the background signal from the plastic slide. This background spectrum was subtracted from the fluorescence spectra of the bacterial cell mass.
Luminescence measurement
We measured the Photoluminescence (PL) spectra of bacterial samples on a Shimadzu RF-6000 spectrofluorophotometer [19]. This device consists of three parts. One contains a photon source (xenon lamp) for sample irradiation. Photons from the lamp pass through a diffraction monochromator, which is used to select the wavelength of photons necessary for the experiment. Irradiating photons are directed to the surface of the sample, which is placed on a special holder in the second part of the device. Excited PL is directed to the entrance slit of another part of the device. In the third part of the device there is also a diffraction monochromator for analyzing the radiation spectrum by wavelengths. Behind the output slit of this monochromator, a photon detector - a photoelectron multiplier - is installed. All device settings, selection of experiment options, display of information on the monitor were carried out using a computer in the Lab Solution software.
Spectra recorded at a speed of 600 nm/min. The scan step of the spectrum was 1 nm. The spectral transmission intervals of both monochromators (both from the photon source and in front of the detector) were chosen equal to 5 nm.
Due to the arrangement of bacterial colonies on plastic fragments from black 3.5” diskettes of rectangular form of 25x25 mm size, we easily changed the samples while maintaining the complete identity of the location of the samples. When measuring the spectra, the samples placed vertically in a holder specially made by us.
We choice geometry of experiment with the angle of incidence of exciting photons from the discharge xenon lamp was 15° to the surface of samples. Correspondingly, the angle of luminescence observation was 75°. The choice of such an experiment geometry is due to the need to exclude excitation photons reflected and scattered from the sample surface which can entering the analyzing part of the device.
When using the excitation wavelength λexc =405 nm, to reduce the number of “extra” photons, a CC-15 light filter (340÷500 nm transmission band with maximum transmission at 400 nm) was installed on the output slit of the first part of the Shimadzu RF-6000 compartment with a xenon lamp. A ZhS-11 light filter was installed on the input slit of the detecting third part of the device (the transmission band starts at 400 nm, the transmission coefficient reaches 95% in the spectral region up to 900 nm). A UFS-5 light filter (transmission band 200÷400 nm, transmission coefficient ~45% at a wavelength of 275 nm) installed at the output slit of the xenon lamp to transmit the ultraviolet range of the spectrum during experiments with λexc =380 nm and λexc =351 nm.
As a result of the experiments in the spectral region 440÷740 nm, PL spectra of 3 types of bacteria were obtained when excited by photons with a wavelength of 405 nm. In Figure 1. the spectra shown are registered for STA bacteria 1 day after seeding and 5 days later.
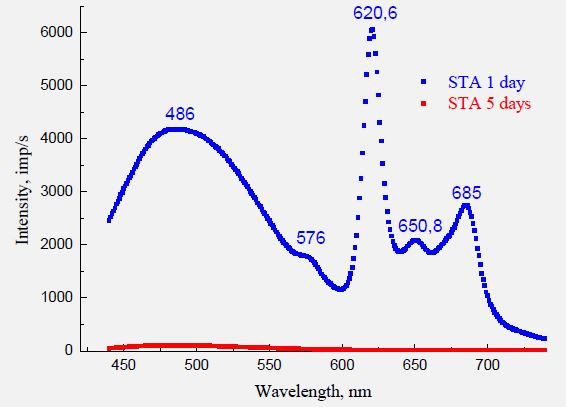
The difference between a one-day and a five-day sample is visible to the naked eye. Obviously, in the absence of “food chains” on the surface of the plastic, the population of bacteria dies. At least five maxima are observed in the spectrum of the daily sample (figures show their positions). Only the maximum at 486 nm can be claimed to be the result of the luminescence of OH radicals based on the analysis of data from works [12,15,20]. But the identification of the emitters of the maxima at 576, 620.6, 650.8, and 685 nm requires a more detailed study of their appearance. In [21], the appearance of a maximum near 620-630 nm is associated with the emission of porphyrins. However, such narrow molecular bands are usually emitted by diatomic fragments of polyatomic molecules.
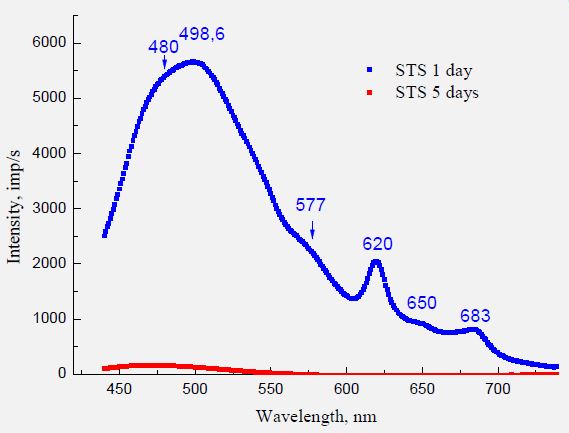
In Figure 2 presents similar spectra for bacteria Staphylococcus Saprophyticus (STS). In this case, a slightly different form of the spectrum is observed. The highest intensity of luminescence is observed in the short-wavelength region of the spectrum in the range of 480-500 nm. Moreover, this maximum, which is associated with OH radiation, already has a clear two-peak structure. This may be related to the attachment of the OH radical to various molecular structures of the bacterium, for example, the formation of H-OH and C-OH bonds. The appearance of a second, even more intense maximum at 498.6 nm indicates the connection of OH with a different chemical element than in STA. In general, the greater intensity of luminescence in the region of 480-500 nm indicates a significantly greater number of OH radicals in the composition of STS bacteria (at least by 30%).
The rest of the maxima (in the figure, their position in nm is shown by numbers) appear, although unlike the STA spectrum, the maximum at 620 nm is no longer dominant, and the luminescence intensity in the range of 650-740 nm is much lower. These differences, namely: the maximum at 620 nm is 3 times lower in intensity than in STA, and the maxima at 650 and 683 nm are not so pronounced and also of lower intensity. If we assume that the same chemical compounds are responsible for the appearance of these maxima in both bacteria (which is very likely), then their content in these bacteria is fundamentally different. This allows us to hope for the use of these results for the development of differential diagnosis of these types of bacteria by photoluminescence spectra in both the short-wave and long-wave regions of the spectrum.
The result of the study of the PL spectrum of PDA bacteria is presented in Figure 3. Similarly, to the previous staphylococcal bacteria, the five-day-old sample practically loses its luminescent properties. However, the one-day sample showed an interesting feature that distinguishes PDA from staphylococcal bacteria. The maximum near 620 nm in this case is quite intense (as in the case of STA), but has a clear two-peak structure with maxima at 622.8 and 634.2 nm, which was not observed in previous cases. This difference shows that the structure of this bacterium is fundamentally different from the structure of staphylococci. According to data [21] (Figure 2) responsible for the emission of the band with a maximum near 620 nm are coproporphyrin, and 634 nm – protoporphyrin IX produced by bacteria.
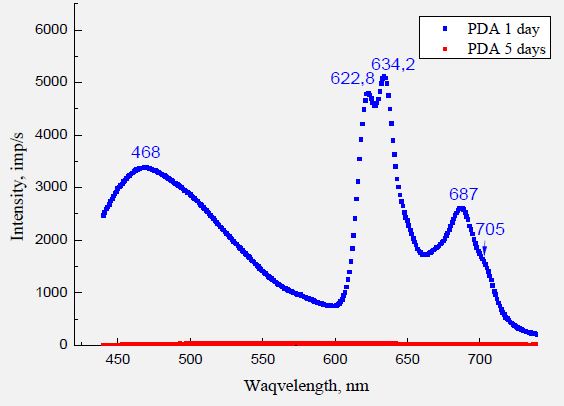
In addition, in the spectrum of this bacterium, the shortest-wavelength position of the first maximum is 468 nm (486 nm in STA, about 500 nm in STS). Probably, in this case, the “attachment” of the OH radical is completely different from in staphylococci. Another fundamental difference is the appearance of the longest-wave maximum at 705 nm, although it has the appearance of a small “shoulder”. A comparison of the photolumiphotoluminescence spectrum with the spectrum of Pseudomonas aeruginosa from [1] shows that they are generally identical. However, our spectrum of bacterial biomass is significantly different in terms of signal magnitude and the above-mentioned features.
The result of the study of five daily samples of STS, STA and PDA are almost indistinguishable in luminescence intensity, but in fact, they differ in shape. In figures 1-3 these spectra are of very low intensity, so this information is very difficult to notice. To make it more convenient in figure 4 these spectra are presented on the same scale. It can be seen that the maximum in STA bacteria is located at 483 nm, while in STS it is at 471 nm. In the case of PDA, this maximum is barely noticeable. It is interesting that the intensity of luminescence (and therefore the number of emitters) remains greater in the case of STS, but their chemical bond changes.
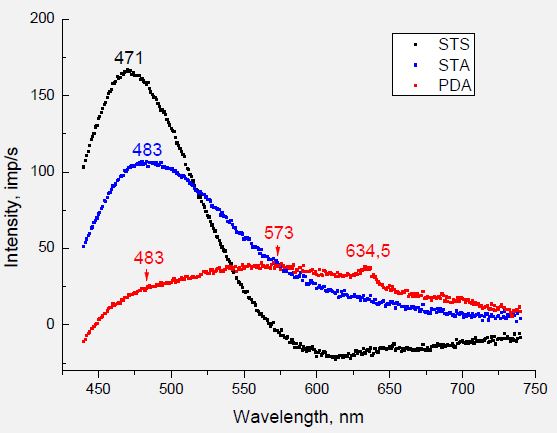
In the STS spectrum, the second maximum near 500 nm practically disappears. Possibly the desorption of OH radicals, which are attached to the bacteria in a different way than in STA, occurs precisely at their expense. The spectrum of PDA shows a broad, gentle maximum at 573 nm. Also, the only one this spectrum that shows the “remains” of the maximum at 634.5 nm. Finally, we note that in the range of 550-740, the values of the luminescence intensity for STS bacteria are negative, and in the spectrum of PDA this is observed at the beginning of the studied spectral range of 440-460 nm. This indicates self-absorption of photons because of different chemical rearrangements in five-day-old bacteria.
In most works, photons with a wavelength (energy) of 405 nm (3.061 eV) (so-called blue light) are used to excite the luminescence of bacterial solutions. We tried to investigate the possibility of conducting such studies with higher photon energy. First, we measured the spectra when excited by photons of a shorter wavelength (higher energy) - 380 and 351 nm, which we used in the research of amino acids and monosaccharides [15,20]. They testified that there is a loss of useful information in the spectra. The capabilities of the Shimadzu RF 6000 also allow measurements of so-called “excitation” spectra. Since the maximum near 620 nm was the most interesting in the photoluminescence spectra of bacterial biomass, we measured such spectra by recording the luminescence wavelength of 616 nm. In Figure 5 shows, the spectra obtained by us for STA and STS bacteria when changing the wavelength of irradiating photons in the range from 380 to 500 nm.
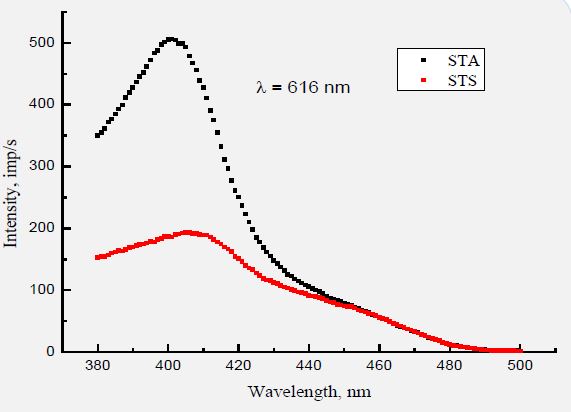
It can be seen that for both bacteria the maximum is located quite close: at 402 (STA) and 407 (STS) nm. That is, the choice for studies of photoluminescence excitation of photons with a wavelength of 405 nm is absolutely correct. In addition, the registered difference in these spectra both in the position of the maxima and in the luminescence, intensity only confirms the correctness of the obtained PL spectra for STA and STS bacteria. Note that for both bacteria, another maximum is observed near 450 nm (2.755 eV). Obviously, this energy of photons is close to the energies of vibrational levels of excited molecules.
We managed to obtain photoluminescence spectra in the spectral range of 440÷740 nm during excitation by photons with λ=405 nm (3.061 eV) from the bacterial biomass of Staphylococcus aureus, Staphylococcus saprophyticus and Pseudomonas aerugenosa. The obtained differences in the spectra of these bacteria allow us to hope for the development of a technique for their differential diagnostic. The spectra also revealed the manifestation of various forms of attachment of OH radicals to these bacteria. Storage of bacterial samples for 5 days leads to a significant decrease in the intensity of photoluminescence. However, the spectra remain informative for the diagnosic of these bacteria. We were also able to confirm that photons with a wavelength of 405 nm are the most optimal option for exciting the photoluminescence of these bacteria.
Author contributions: Yu A Bandurin, Sh B Molnar and OO Bandurin contributed to photoluminescence experiments and analysis of their results. BM Sharga and O Yu Bandurin contributed to preparation of bacterial samples and analysis of the results. All authors participated in the discussion of results and preparation of the manuscript.
Conflict of interests: The authors declare that they have no conflicts of interest.