1Department Radionuclide Diagnostics, Medical Radiological Research, Russia.
2Vernadsky Institute of Geochemistry and Analytical Chemistry of Russian Academу of Science, Russia.
V Zaichick, PhD, DSc, CChem, FRSC
Tel: (48439) 60289, Fax: (495) 956 1440;
Email: vzaichick@gmail.com
Received : May 09, 2025 Accepted : Jun 23, 2025 Published : Jun 30, 2025 Archived : www.meddiscoveries.org
Objective: Many women around the world suffer from Benign Breast Diseases (BBD). The etiology of this disease remains largely unclear, although it is known that disturbances of somatic elemental homeostasis play a certain role in breast pathology. This study was aimed at identifying changes in the content of chemical elements during the benign transformation of breast tissue.
Methods: For this purpose, we used the previously developed method of sample preparation, which allows determining the content of Al, Ba, Ca, Cu, Fe, K, Mg, Mn, Na, Ni, P, S, Si, Sr, Ti and Zn in micro samples of breast tissue by using atomic emission spectrometry with inductively coupled plasma. Using the developed technique, samples of benignly transformed (n=17) and normal (n=38) breast tissue were examined.
Results: A significantly higher content of all the chemical elements studied, except for Si, was found in benignly transformed tissue compared to their content in the normal tissue.
Conclusions: The detected multiple increase in the content of many chemical elements in benignly transformed tissue compared to normal breast tissue can be used to develop new methods for in vitro and in vivo BBD diagnostics, in which the chemical elements levels in breast lesion will act as markers. Further deeper study and understanding of the detected phenomenon will allow the development of new methods for the prevention and treatment of BBD.
Keywords: Benign breast diseases; Chemical elements; Inductively coupled plasma atomic emission spectrometry; Benignly transformed breast tissue; Normal breast tissue.
Benign Breast Diseases (BBD) include a wide range of clinical changes in the mammary gland [1]. Many women around the world suffer from BBD. For example, diseases such as fibrocystic changes occur in 50% of all women over 30 years of age, and fibroadenomas occur in 25% of women and are the most common benign tumors of the mammary gland [1]. BBD are often accompanied by malignant transformation of mammary gland tissue. For example, complex cysts carry a risk of malignancy from 23% to 31%, and papillary lesions 16% [1]. Therefore, all types of BBD are generally recognized as a risk factor for Breast Cancer (BC) [2,3]. Screening tests for early detection of BC typically use full-field digital mammography and ultrasound. In complex cases, if there are doubts, histological confirmation is resorted to using percutaneous core needle biopsy. Since a biopsy is a great psychological trauma for every woman, sometimes more complex examination methods, such as contrast Magnetic Resonance Imaging (MRI), are used before this procedure [4,5]. However, although contrast-enhanced MRI has demonstrated higher sensitivity than mammography and ultrasonography, its specificity is insufficient, leading to the problem of false-positive results. Thus, approximately 70–80% of biopsies performed after contrast MRI give a false positive result [4]. Thus, screening examinations require multiple histological confirmations, which causes a significant burden on the health care system and represents a major social problem associated with discomfort for many women. Therefore, the search for specific characteristics of benign and malignantly transformed breast tissues that could be used for differential diagnosis of these pathologies continues.
Previously, in our studies, it was shown that benign and malignantly transformed tissues of bones [6-13], prostate [14-21], and thyroid [22-32] glands differ significantly in the level of many Chemical Elements (ChEs), which made it possible to use these differences for differential diagnosis of these pathologies. These results, as well as the fact that almost 50% of benign breast disease subtypes are associated with microcalcifications [33], suggest the presence of specific levels of ChEs characteristic of benignly transformed breast tissue.
Information about the elemental composition of benignly altered breast tissue is of interest not only from the point of view of searching for diagnostic indicators. It can also reflect the causes of pathology. It is known that the global spread of BBD is influenced by a complex interaction of genetic, environmental and lifestyle factors. One of the environmental factors is ChEs that enter the human body with food, drinking water and air. Earlier, we paid special attention to the role of ChEs in the normal physiology of the mammary gland [34]. In the present study, we proceeded from the fact that a violation of elemental somatic homeostasis (deficiency or excess) can provoke pathological transformation of mammary gland [35,36]. To ensure the possibility of studying not only normal tissue samples obtained during autopsy, but also pathologically altered mammary gland tissue, we developed a sample preparation technique that allows determining the content of 16 ChEs in small tissue samples using Inductively Coupled Plasma Atomic Emission Spectrometry (ICP-AES). This method made it possible to use tissue samples obtained using percutaneous core needle biopsy [37].
To date, several papers have been published in which the content of ChEs in normal and benignly transformed breast tissue was studied using various analytical methods [38-61]. However, due to the large scatter of published quantitative data, and sometimes their inconsistency, it is not possible to draw unambiguous conclusions about the normal levels of ChEs characteristic of normal breast tissue, as well as about the changes in the elemental composition occurring in BBD. Also, no systematic reviews on this topic were found in the literature that could resolve the existing contradictions and draw adequate conclusions.
The present study was aimed at comparing the content of ChEs in benignly transformed breast tissue with the content of the same ChEs in the breast tissue of healthy women. To determine the content of ChEs, we used a previously developed technique [37]. To assess the reliability of our results, a systematic analysis of the published data on the content of ChEs in benign transformed and normal breast tissue was carried out. The analysis performed allowed us to determine the median values of the data available in the literature and made it possible to compare the identified median values with our results.
Tissue samples
The study used a collection of benignly transformed breast tissue samples obtained by percutaneous core needle biopsy. The collection was collected by surgeons of the Torrocal Department of the Medical Radiological Research Center (Obninsk) in the 1990s. After biopsy, the obtained material was weighed, lyophilized [62], and weighed again. Then, each dried tissue sample was sealed in polyethylene film pre-treated with rectified ethyl alcohol, and in sealed form placed in a numbered polyethylene capsule. Samples were stored in a fume hood at room temperature. As our studies have shown, lyophilized tissue samples in this form can be stored for decades without changing the levels of ChEs in them [63,64]. Eleven tissue samples were obtained from women with fibrocystic breast disease, and 6 samples represented fibroadenoma tissue. The women’s age ranged from 18 to 43 years. All patients were Caucasian, with a Caucasian lifestyle.
To compare the obtained results with the levels of ChEs content characteristic of the mammary glands of healthy women, randomized samples of normal mammary gland tissue were obtained during autopsy from 38 Caucasian women (aged 16 to 60 years) who had died suddenly. An autopsy was performed in the forensic medical examination department of the Obninsk City Hospital on the first day after the sudden death. The typical causes of death for most of these women were automobile accidents and injuries. Available clinical data were reviewed for each victim. None of them had a history of intersex diseases, endocrine diseases, neoplasms or other chronic diseases that would interfere with normal breast development. None of the subjects received drugs that affected the morphology of the mammary gland and/or the content of ChEs in the gland. Morphologically, each breast tissue sample taken corresponded to the age norm. After weighing the samples intended for elemental analysis, they were lyophilized and homogenized.
All studies were approved by the Ethical Committees of the Medical Radiological Research Centre, Obninsk. All the procedures performed in studies involving human participants were in accordance with the ethical standards of the institutional and/or national research committee and with the 1964 Helsinki declaration and its later amendments, or with comparable ethical standards
Sample preparation and ICP-AES measurements
To implement this study, we used our own developed method of sample preparation, which allows us to determine the content of a number of ChE in small tissue samples by using Inductively Coupled Plasma Atomic Emission Spectrometry (ICP-AES) [37]. This micro method allows us to determine the content of the following elements: Aluminum (Al), Barium (Ba), Calcium (Ca), Copper (Cu), Iron (Fe), Potassium (K), Magnesium (Mg), Manganese (Mn), Sodium (Na), Nickel (Ni), Phosphorus (P), Sulfur (S), Silicon (Si), Strontium (Sr), Titanium (Ti) and Zinc (Zn) in milligram quantities of the sample under study. The ICP-AES method was chosen due to its high sensitivity, which made it possible to simultaneously determine the content of 16 ChE in a small tissue sample, which is usually obtained during a puncture biopsy [37]. For sample preparation and elemental analysis, deionized water distilled without boiling in a PTFE Subboiler ECO IR Maassen “Water and acid cleaning system” (Germany) and nitric acid for analysis (65%, max. 0.005 ppm Hg) from Merck (Germany) were used. A 2% nitric acid solution was prepared by diluting the initial solution with deionized water and then used to prepare the analyzed solutions.
A single puncture biopsy usually collects material weighing about 10-20 mg. Therefore, we initially developed a method for microwave autoclave acid digestion of small breast tissue samples weighing from 10 mg, which was used in the current study [65].
Elemental analysis of the samples by Inductively Coupled Plasma Atomic Emission Spectrometry (ICP-AES) was performed using an ICAP-6500 Duo plasma spectrometer (Thermo Scientific). The spectrometer was calibrated using Merck standard multi-element reference solutions (Merck, KGaA, Darmstadt, Germany) and high-purity standards (North Charleston, South Carolina, USA). Detection Limits (DL) of each element were determined as: DL = 3 SD0/SS, where SD0 is standard deviation of the background signal and SS is signal sensitivity. To minimize matrix effects, analytical emission lines were selected as follows. On the one hand, their intensity should be sufficient for correct determination of the content of the element, i.e. above the Limit of Quantitation (LOQ), calculated as: LOQ=10 SD0/SS. On the other hand, the effect of overlapping lines from other elements should be minimal. Usually, two lines were selected, corresponding to both conditions.
The spectral range (166–847 nm) is recorded by a highly sensitive CID semiconductor detector. The optical block of the device is thermally stabilized and purged with argon. High-purity argon (99.993%) is used as a plasma-forming gas. The plasma power is 1150 W. The rates of the plasma-forming argon flow, transport flow, and cooling flow are 0.5 l/min, 0.55 l/min, and 12 l/min, respectively. The element content in the analyzed solutions was measured using iTEVA analytical software and MS Excel. To verify the accuracy of the obtained results, Polish certified reference materials MODAS-5 (Cod tissue) and MODAS-3 (Herring tissue) and the CRM prepared by the International Atomic Energy Agency IAEA-153 (Milk powder) were used. A more detailed description of the methodology developed and used by us was published earlier [37,65].
Systematic mini review
A systematic search was performed using PubMed, Web of Science, Scopus, and Google Scholar to identify literature published up to March 2025 on the considered elements (Al, Ba, Ca, Cu, Fe, K, Mg, Mn, Na, Ni, P, S, Si, Sr, Ti, and Zn) in benignly transformed and normal breast tissue. The key terms used in the search strategy included “chemical elements” or “trace elements” in combination with “normal breast”, “normal breast tissue”, “health breast tissue”, or “benign breast disease”, “benign breast tumor”, “breast fibroadenoma”, and “fibrocystic breast disease”. In addition, we searched for all results reported in previous reviews and relevant meta-analyses on the topic of interest.
The identified studies were included only if they met the following standards: (1) only studies involving human participants were included; (2) quantitative data on the ChEs of interest were presented; (3) in patients with benign breast disease, the diagnosis was confirmed morphologically. In some cases, review articles were included in our study if they were relevant to the topic and met the above requirements, but the main focus was on original works. There were no restrictions on the language of published papers. Subsequently, the literature data were collected and classified for each ChE depending on the breast tissue (benignly transformed or normal). From the published data, the median of the mean values for benignly transformed and normal breast tissue was found for each specific ChE.
Statistics
The main statistical parameters such as arithmetic mean, standard deviation, and standard error of the mean for mass fraction of ChEs (mg/kg dry weight) were calculated using MS Excel. The significance of differences in the results between the two groups (benign transformed and normal breast tissue) was assessed using the parametric Student’s t-test and the nonparametric Wilcoxon-Mann-Whitney U-test. MS Excel was also used to determine the median values of the mean contents of Al, Ba, Ca, Cu, Fe, K, Mg, Mn, Na, Ni, P, S, Si, Sr, Ti and Zn in benignly transformed and normal breast tissue found in the published papers.
The results of determination of mass fraction of Al, Ba, Ca, Cu, Fe, K, Mg, Mn, Na, Ni, P, S, Si, Sr, Ti and Zn in three different international certified reference materials MODAS-5 (cod tissue), MODAS-3 (herring tissue) and IAEA-153 (milk powder) obtained using our developed ICP-AES method are presented in Table 1.
The mean values of the mass fraction and standard deviation (M±SD) of the ChEs in benignly transformed beast tissue (MBT), obtained using the ICP-AES micro method developed by us, were (mg/kg dry tissue): Al 8.44±6.49; Ba (0.68); Ca 428±174; Cu 1.91±0.93: Fe 44.7±31.4; K 3378±2235; Mg 233±136; Mn <0.2*; Na 10161±4976; Ni (0.30); P 2365±1641; S 4626±1824; Si 2.59±1.27; Sr 0.67±0.43; Ti 3.41±2.60; and Zn 29.7±16.4, and in the normal breast tissue (MN): Al 3.63±2.40; Ba <0.1*; Ca 75.7±62.9; Cu 0.56±0.41; Fe 13.8±12.3; K 194±114; Mg 18.5±9.0; Mn <0.2*; Na 686±516; Ni <0.1*; P 201±74; S 385±224; Si 8.02±4.67; Sr 0.55±0.24; Ti <1.0*; Zn 3.29±1.65 (*detection limit, in parentheses - possible upper limit of the mean).
The Ba, Ni, and Ti mass fractions in benignly transformed breast tissue were determined just in few samples. The possible upper limit of the mean (Mmax) for these ChEs was calculated as the mean mass fraction, using the value of the Detection Limit (DL) instead of the individual value when the latter was found to be below the DL:
where Ci is the individual value of the ChE mass fraction in sample i, ni is the number of samples with mass fraction higher than the DL, nj is number of samples with mass fraction lower than the DL, and n = ni + nj is number of samples that were investigated.
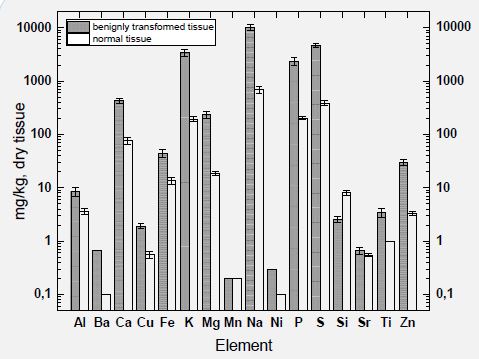
Figure 1 demonstrates the mean mass fraction and the range of the standard error of the mean (M±SEM) for each of the 16 studied ChEs in the compared pairs - benignly transformed and normal beast tissue. The diagram shows the logarithmic scale of mass fractions of the ChEs along the ordinate axis. The abscissa axis shows all the ChEs determined in this study in alphabetical order. Two columns are given for each element: the height of the first (shaded) column reflects the mean value of the mass fraction of the ChE in benignly affected breast tissue, and the top of the second column reflects the mean mass fraction of this ChE in healthy breast tissue. The diagram clearly shows that the levels of all ChEs in benignly affected breast tissue, with the exception of Si, are higher than the levels characteristic of the norm.
Table 2 depicts the differences between the mean values of the mass fractions of the studied elements in the benignly transformed and normal beast tissue, assessed using the parametric Student t-test and the nonparametric Wilcoxon-Mann-Whitney U-test.
Comparison of our results with literature data for the mass fractions of Al, Ba, Ca, Cu, Fe, K, Mg, Mn, Na, Ni, P, S, Si, Sr, Ti, and Zn in the benignly transformed and normal beast tissue is shown in Tables 3 and 4, respectively. Column 3 of these tables presents the median of the published mean values for each ChE, and in parentheses the number of studies that contained quantitative data on the content of this ChE in benignly transformed or normal breast tissue is indicated. Columns 4 and 5 indicate, respectively, the minimum and maximum values (arithmetic mean ± standard deviation or median) of the mass fraction of each ChE found from the reported data; the number of samples studied is indicated in parentheses and the corresponding link is given in square brackets.
A comparison of the ratio of the mean mass fraction of ChEs in the benignly transformed and normal beast tissue obtained in this work with the corresponding ratios calculated from published results are presented in Table 5. To obtain the corresponding ratios according to the literature, we used the median values of the mass fractions of ChEs in the benignly transformed and normal beast tissue.
| El | MODAS-5 | MODAS-3 | IAEA-153 | |||
|---|---|---|---|---|---|---|
| Certificate | Ourresult | Certificate | Ourresult | Certificate | Our result | |
| Al | - | 6±1 | - | 14±1 | - | - |
| Ba | 0.16±0.03 | 0.18±0.02 | 2.71±0.28 | 2.6±0.1 | - | 0.67±0.04 |
| Ca | 1100 | 1200±100 | 36900 | 39800±900 | 12870±320 | 12900±600 |
| Cu | 1.38±0.09 | 1.5±0.1 | 3.19±0.22 | 3.3±0.1 | 0.57±0.20 | 0.48±0.03 |
| Fe | 13.2±1.1 | 14.5±2.3 | 190±13 | 210±30 | 2.53±0.91 | 3.4±1.8 |
| K | 19300±1200 | 18100±700 | 11800±1300 | 10700±500 | 16480±1140 | 16400±800 |
| Mg | 1200±200 | 1111±43 | 3000±200 | 2522±74 | 1060±75 | 948±48 |
| Mn | 0.92±±0.08 | 0.89±0.05 | 5.78±0.61 | 5.3±0.1 | - | 0.22±0.04 |
| Na | 3400±200 | 3100±100 | 19400±1700 | 16200±700 | 4180±290 | 3700±200 |
| Ni | 0.136 | 0.14±0.02 | 0.32±0.05 | 0.5±0.1 | - | 0.13±0.02 |
| P | 9600±1200 | 10000±400 | 23500±3900 | 26100±600 | 10100±1020 | 9600±500 |
| S | 10500±1600 | 12200±400 | 9300±1000 | 10900±400 | - | - |
| Si | - | - | - | - | 17±12 | - |
| Sr | 4.07±0.36 | 3.9±0.3 | 192±15 | 177±5 | 4.09±0.62 | 4.1±0.2 |
| Ti | - | <0.9 | - | <2.1 | <0.2 | |
| Zn | 20.1±1.1 | 22±2 | 111±6 | 111±3 | 39.6±1.8 | 38±2 |
El: Element; M: Arithmetical Mean; SD: Standard Deviation.
| Element | Female breast tissue | Ratio | |||
|---|---|---|---|---|---|
| BT tissue | Normal tissue | Student’s t-test p< | U-test* p | BTto normal tissue | |
| Al | 8.44±1.57 | 3.63±0.41 | 0.00837* | <0.01* | 2.33 |
| Ba | 0.68 | <0.1* | - | - | >6.8 |
| Ca | 428±43 | 75.7±10.8 | 0.00001* | <0.01* | 5.65 |
| Cu | 1.91±0.22 | 0.56±0.09 | 0.00001* | <0.01* | 3.41 |
| Fe | 44.7±7.6 | 13.8±2.1 | 0.00097* | <0.01* | 3.24 |
| K | 3378±542 | 194±20 | 0.00002* | <0.01* | 17.4 |
| Mg | 233±33 | 18.5±1.6 | 0.00001* | <0.01* | 12.6 |
| Mn | <0.2* | <0.2* | - | - | - |
| Na | 10161±1207 | 686±91 | 0.00001* | <0.01* | 14.8 |
| Ni | 0.30 | <0.1* | - | - | >3.0 |
| P | 2365±398 | 201±13 | 0.00005* | <0.01* | 11.8 |
| S | 4626±443 | 385±40 | 0.00001* | <0.01* | 12.0 |
| Si | 2.59±0.33 | 8.02±0.82 | 0.00001* | <0.01* | 0.32 |
| Sr | 0.67±0.10 | 0.55±0.04 | 0.314 | >0.05 | 1.22 |
| Ti | 3.41±0.67 | <1.0* | 0.00290* | <0.01* | >3.41 |
| Zn | 29.7±4.0 | 3.29±0.30 | 0.00001* | <0.01* | 9.03 |
M: Arithmetic Mean; SEM: Standard Error of Mean; t-test: Student’s t-test; U-test: Wilcoxon-Mann-Whitney U-test; *Significant values.
| Tissue/Element | This work results | Published data [Reference] | ||
|---|---|---|---|---|
| M±SD | Med. of means (n)* | Min of meansM or M±SD, (n)** | Max of meansM or M±SD, (n)** | |
| Al | 3.63±2.40 | 3.6(6) | <0.1 (8) [38] | 38.4(20) [39] |
| Ba | <0.1* | 0.047(4) | 0.03 (-) [40] | 6.24±0.59(-) [41] |
| Ca | 75.7±62.9 | 262(7) | 52.6±10.6 (-)[41] | 680(2) [42] |
| Cu | 0.56±0.41 | 1.08(22) | 0.137 (63) [43] | 2280±140(-) [44] |
| Fe | 13.8±12.3 | 14.0(19) | 0.056 (63) [45] | 75.6(20) [46] |
| K | 194±114 | 676(7) | 272 (20)[39] | 4600(-) [47] |
| Mg | 18.5±9.0 | 85.5(4) | 9.9±1.8 (-) [41] | 680(4) [42] |
| Mn | <0.2* | 0.35(8) | 0.06 (-) [40] | 3.74(4) [42] |
| Na | 686±516 | 2000(7) | 392±56 (-) [41] | 5380(3) [42] |
| Ni | <0.1* | 0.043(8) | 0.0018 (8) [38] | 1.14(20) [39] |
| P | 201±74 | 2000(8) | 280 (-)[40] | 56000±5460(-) [44] |
| S | 385±224 | 4000(6) | 2000 (-) [48] | 7600(-) [47] |
| Si | 8.02±4.67 | 0.235(5) | 0.00024±0.00003 (-) [49] | 0.24±0.39(16) [50] |
| Sr | 0.55±0.24 | 0.45(4) | 0.12 (-) [40] | 070±0.22(-) [41] |
| Ti | <1.0* | <0.10(3) | <0.04 (8) [38] | 0.16(1) [51] |
| Zn | 3.29±1.65 | 7.48(20) | 0.21 (63) [45] | 27.8±5.0(20) [52] |
M: Arithmetic Mean; SD: Standard Deviation; *Detection limit.
| Tissue/Element | This work results | Published data [Reference] | ||
|---|---|---|---|---|
| M±SD | Med. of means (n)* | Min of meansM or M±SD, (n)** | Max of meansM or M±SD, (n)** | |
| Al | 8.44±6.49 | 50.5(1) | 50.5±23.9(61) [53] | 50.5±23.9(61) [53] |
| Ba | (0.68) | - | - | - |
| Ca | 428±174 | 618(6) | 197±140(25) [54] | 8850(9) [55] |
| Cu | 1.91±0.93 | 6.00(9) | 1.80±0.41(18) [56] | 99.0±114.5(14) [57] |
| Fe | 44.7±31.4 | 57.1(10) | 32.8±5.8(50) [52] | 339±308(14) [57] |
| K | 3378±2235 | 1269(4) | 356±52(68) [58] | 5785±4475(14) [57] |
| Mg | 233±136 | 168(2) | 19.6±5.4(11) [59] | 317±438(61) [53] |
| Mn | <0.2* | 1.07(3) | 0.90±1.05(61) [53] | 1.25±0.50(50) [52] |
| Na | 10161±4976 | 4515(1) | 4515±4595(61) [53] | 4515±4595(61) [53] |
| Ni | (0.30) | 0.485(3) | 0.47±0.10(68) [58] | 10.4±15.1(61) [53] |
| P | 2365±1641 | 1189(3) | 1115±165(68) [58] | 15430±18580(14) [57] |
| S | 4626±1824 | 17893(2) | 3070±145(68) [60] | 32715±17125d(14) [57] |
| Si | 2.59±1.27 | 1910(1) | 1910±1080(14) [57] | 1910±1080(14) [57] |
| Sr | 0.67±0.43 | 20.6(1) | 20.6±28.2(61) [53] | 20.6±28.2(61) [53] |
| Ti | 3.41±2.60 | - | - | - |
| Zn | 29.7±16.4 | 35.6(10) | 15±8(23) [61] | 253±179(14) [57] |
M: Arithmetic Mean; SD: Standard Deviation; *Detection limit
| Element | Medians of the reported means (n)* | This work result | ||
|---|---|---|---|---|
| BT tissue | N tissue | Ratio BT to N | Ratio BT to N | |
| Al | 50.5(1) | 3.6(6) | 14.0 | 2.33 |
| Ba | - | 0.047(4) | - | >6.8 |
| Ca | 618(6) | 262(7) | 2.36 | 5.65 |
| Cu | 6.00(9) | 1.08(22) | 5.56 | 3.41 |
| Fe | 57.1(10) | 14.0(19) | 4.08 | 3.24 |
| K | 1269(4) | 676(7) | 1.88 | 17.4 |
| Mg | 168(2) | 85.5(4) | 1.96 | 12.6 |
| Mn | 1.07(3) | 0.35(8) | 3.06 | - |
| Na | 4515(1) | 2000(7) | 2.26 | 14.8 |
| Ni | 0.485(3) | 0.043(8) | 11.3 | >3.0 |
| P | 1189(3) | 2000(8) | 0.59 | 11.8 |
| S | 17893(2) | 4000(6) | 4.47 | 12.0 |
| Si | 1910(1) | 0.235(5) | 8128 | 0.32 |
| Sr | 20.6(1) | 0.45(4) | 45.8 | 1.22 |
| Ti | - | <0.10(3) | - | >3.41 |
| Zn | 35.6 (10) | 7.48(20) | 4.76 | 9.03 |
(n)* – the number of all found articles for each chemical element.
Acceptable agreement of the values of the content of ChEs in the international certified reference materials MODAS-5 (Cod tissue), MODAS-3 (Herring tissue), IAEA-153 (Milk powder) obtained in this study with the data of the corresponding certificertificates (Table 1) indicates sufficient accuracy of the developed ICP-AES micro method [37,65] and reliability of the mass fractions of Al, Ba, Ca, Cu, Fe, K, Mg, Mn, Na, Ni, P, S, Si, Sr, Ti and Zn in samples of benignly transformed and normal breast tissue, presented in Figure 1 and Tables 2-5.
Mass fractions of Al, Ca, Cu, Fe, K, Mg, Na, P, S, Si, Sr, and Zn were determined in all or most of the samples of both benignly transformed and normal breast tissue. This allowed us to calculate the main statistical characteristics for the mass fractions of these elements, such as the arithmetic mean (M), standard deviation of the mean (SD) and Standard Error of the Mean (SEM) (Tables 2-5). Levels of Ba, Mn, Ni, and Ti in all samples of normal breast tissue were below detection limits of our method ICP-AES (Table 3). In all benignly transformed breast tissue samples, only Mn content was below detection limit, while Ba, Ni, and Ti content were determined in several samples. This allowed us to calculate the possible upper limit of the mean value (Mmax) for these ChEs using the equation 1.
The M, SD and SEM values are valid only if the results of determination of the content of ChEs in the studied samples are distributed normally. Only after making sure that the distribution of the results within each of the two studied groups of samples (benignly transformed and normal breast tissue) is normal, it is possible to use M, SD and SEM for comparison using parametric criteria, for example, Student’s t-test. However, reliable detection of normal distribution of results with a relatively small number of samples in the presented study (n=17 and n=38, respectively) is impossible, since the existing criteria for detection of the type of distribution of results require a large sample size, usually several hundred samples. Since in our study it was not possible to prove or disprove the “normality” of the distribution of the obtained results due to the small sample size, in addition to the parametric Student’s t-test, the nonparametric Wilcoxon-Mann-Whitney U-test was also used, which is applicable to any type of distribution of the results of the content of ChEs in breast tissue.
To assess the effect of benign transformation of breast tissue on the content of ChEs in it, a comparison of the elemental composition of benignly transformed and normal breast tissue was performed (Table 2). In benignly altered tissue, the mass fractions of all studied elements, except for Si, exceeded the levels characteristic of normal breast tissue. To compare the two groups of samples (benignly transformed and normal breast tissue), both the parametric Student’s t-test and the nonparametric Wilcoxon-Mann-Whitney U-test were used, and both criteria confirmed the reliability of the difference in the mass fractions of all elements except Ba, Mn, Ni, and Sr.
In the study of ChEs in the mammary gland in norm and pathology, both tissue samples obtained from healthy women and samples of visually intact tissue adjacent to the tumor are used as the “norm”. However, mixing these two groups of samples is incorrect. For example, we have previously shown that in terms of the ChEs content, intact tissue adjacent to thyroid tumors is not identical to normal thyroid tissue in apparently healthy individuals [66,67]. Therefore, in our review of the literature (Table 3), only the results obtained from studies of breast tissue samples from healthy women were used. Some values of the mass fractions of ChEs were not expressed by the authors of the cited works in terms of dry tissue. However, we calculated these values using literature data on the water content of 50% [68] and ash content of 1% (in dry tissue) [69] in the mammary gland of adult women.
When considering the published data in Table 3 and 4, attention is drawn to the huge difference between the minimum (column 4) and maximum (column 5) values, which for almost all ChEs amounts to two, three or more orders of magnitude. Such a wide range of published data, in our opinion, is mainly due to the insufficient attention of many authors to proper quality control of their results including sampling. The lack of proper control allows for random errors both in the direction of underestimation and in the direction of overestimation of the analysis result. Since errors are random in nature, as the number of observations increases, the median of accumulated data on the content of one or another ChE in breast tissue should approach the true value. This interpretation of the existing spread of accumulated data allows us to compare our results (column 2) with the medians of published mean mass fractions (column 3) for each ChE.
As follows from the data in Table 3, the results obtained for most of the studied ChEs were in fairly good agreement with the medians of previously published mean values of ChEs content in normal breast tissue and fit within their range (min - max). The only exceptions were K, P, S, and Si. Our results for K, P, and S were slightly below the corresponding median values and outside the lower limit of the range of published mean values. In contrast, our result for Si was more than an order of magnitude higher than the median of published mean values.
The values of the mean mass fractions of ChEs in benignly transformed breast tissue that we obtained were in good agreement with the median values of published data (Table 4). The only exceptions were Na, Si and Sr, for which we found only one paper in the literature. In the available literature, no data on the content of Ba and Ti in benignly transformed breast tissue were found.
If to use the ratios of median values of mean mass fractions of ChEs in normal and benignly transformed breast tissue, found from the analysis of literature data (Tables 3 & 4, respectively), they can be compared with the corresponding ratios of mean values of ChEs content in these tissues obtained in the present study and presented in Table 2. Calculation of these ratios showed that the increase in the content of almost all studied ChEs during benign transformation of breast tissue discovered in the present study agreed with the results we obtained from the analysis of published data (Table 5). Thus, both from the data obtained in the present study and from our calculations made based on literature data, it clearly followed that the content of such elements as Al, Ca, Cu, Fe, K, Mg, Na, Ni, S, Sr, and Zn in benignly transformed tissue is higher than in normal breast tissue (Table 5).
For a few ChEs (Ca, Cu, Fe, S, and Zn) this increase was multiple (3 or more times). Such significant changes suggest the potential possibility of using the level of these ChEs in the lesion of the mammary gland as bioindicators of BBD. The use of ChEs levels in transformed breast tissue as BBD markers seems to be very promising, since the capabilities of modern nuclear analytical methods are rapidly increasing. For example, the distribution of such diagnostically promising ChEs as Fe and Zn in the mammary gland can be determined non-invasively using neutron stimulated emission computed tomography [70].
It is known that Ca, K, Mg and Na ions are the main electrolytes of the body. Na ions are concentrated mainly in the extracellular space, and Ca, K and Mg ions are concentrated inside the cells. Ions of all these metals regulate intracellular metabolism. Thus, the obtained results indicate colossal changes in intracellular metabolism during BBD. The metals Cu, Fe, Zn are part of many biologically active substances and are extremely important microelements for the vital functions of the body. Their content inside the cells is under strict homeostatic control, since they form the epigenetic intracellular environment. A multiple increase in the intracellular concentration of these metals may be the cause of tumorigenesis.
One of the possible explanations for the observed phenomenon of multiple increase in the content of ChEs in benignly transformed tissue may be associated with structural changes in the tissue, since the content of ChEs in different structures is different, as well as with disturbances in the intracellular metabolism of ChEs that occur when the mechanisms regulating the proliferation of cells break down. As a result of such disturbances, a change in the permeability of cell membranes and subsequent excessive accumulation of ChEs in cells may occur.
Another possible explanation may be associated with excessive intake of ChEs into the body with food, water and air due to uncontrolled changes in the content of ChEs in the environment. Even a slight increase in the intracellular concentration of such metals as Cu, Fe, Zn, the levels of which are under conditions of strict homeostasis, can provoke the process of excessive proliferation of cells. In this case, an increase in the content of these ChEs should be detected not only in transformed tissue, but also in visually intact tissue adjacent to the lesion of the mammary gland. To confirm or refute the possibility of such a variant of the development of BBD, we plan to compare the content of ChEs in samples of visually intact tissue adjacent to the lesion with the levels of ChEs typical of breast tissue in healthy women.
As for the limitations of the present study, first, it should be noted that the sample size of the studied samples of benignly transformed (n=17) and normal breast tissue (n=38) was relatively small. This did not allow us to determine the content of ChEs considering the histological structure of the transformed tissue, which is of particular interest for diagnostics, prognosis and choice of treatment tactics. Therefore, we plan to continue collecting samples and analyzing the material obtained.
The revealed multiple increase in the content of ChEs in benignly transformed breast tissue opens up great prospects for the development of new in vitro and in vivo methods for differential diagnostics of BBD and BC, in which ChEs levels will act as tumor markers. For this purpose, further study of the content of ChEs in the tissue of the lesion in benign and malignant diseases of the mammary gland and comparison of the obtained results are necessary. We plan to conduct such studies in the future.
The developed method of sample preparation allows us to obtain reliable data of the content of Al, Ba, Ca, Cu, Fe, K, Mg, Mn, Na, Ni, P, S, Si, Sr, Ti, Zn in samples of benignly transformed and normal breast tissue with the help of ICP-AES. An important feature of the developed method is the ability to determine the content of ChEs in samples weighing only a few milligrams, which allows it to be used for analyzing puncture biopsy materials. In the present study, a significant increase in the content of all the studied ChEs in the breast tissue during its benign transformation, except for Si, was revealed. All the differences revealed were generally agreed with the results of our analytical review of the literature. The results obtained in this work provide a solid basis for the development of new methods for diagnosing BBD based on the use of the level of ChEs in the tissue of the breast lesion. Further detailed studies are needed to clarify the role of accumulation of many ChEs in benignly transformed tissue in the etiology and pathogenesis of BBD. Our further studies will be aimed at increasing the sample size, as well as studying the content of ChEs in malignant breast tumors.
Author’s contributions: Zaichick V contributed to conception and design of the study, statistical analysis, data analysis and interpretation, manuscript preparation and review. Dogadkin D contributed to experimental studies, data acquisition, and diagram design. Gromyak I. and Shirokova V. contributed to experimental studies and data acquisition. Kolotov V contributed to manuscript editing, data interpretation, and administrative support.
Conflict of interest: All authors declared that there are no conflicts of interest.
Acknowledgements: The authors are extremely grateful to the late head of the thoracic department of the Medical Radiological Research Center, Prof., Dr. P.P. Firsova, and the doctor of this department, F.V. Medvedev for supplying breast samples.